The short version
- Under fixed-fee agreements, every extra ticket is a cost, not revenue. Growth that brings proportionally more tickets barely improves profit.
- Preventing 20% of tickets in our example releases 120 engineering hours a month, worth $72,000 a year in capacity.
- Start with your PSA data: a small number of recurring problems usually drive a large share of the workload.
- The biggest levers are root cause fixes, a Centralised Services Engineer, automation and standardisation.
- Measure engineering hours and cost per managed user, not ticket counts alone.
The most profitable MSP ticket is the one that never gets created
For many Managed Service Providers (MSPs), the service desk operates like a production line. Tickets arrive, engineers investigate, problems are resolved and the next request is waiting in the queue. As the MSP acquires more customers, ticket volumes increase and the business responds by recruiting more engineers to manage the workload.
It's a familiar pattern, but it creates a significant challenge for MSP profitability.
Break-fix economics
- More support requests meant more billable revenue
- Ticket volume and income rose together
Fixed-fee economics
- Customers pay a predictable monthly fee, however many issues they have
- Every extra ticket consumes engineering time and adds cost
This means an MSP can grow its monthly recurring revenue (MRR) while seeing little improvement in profitability, because service delivery costs grow at almost the same rate.
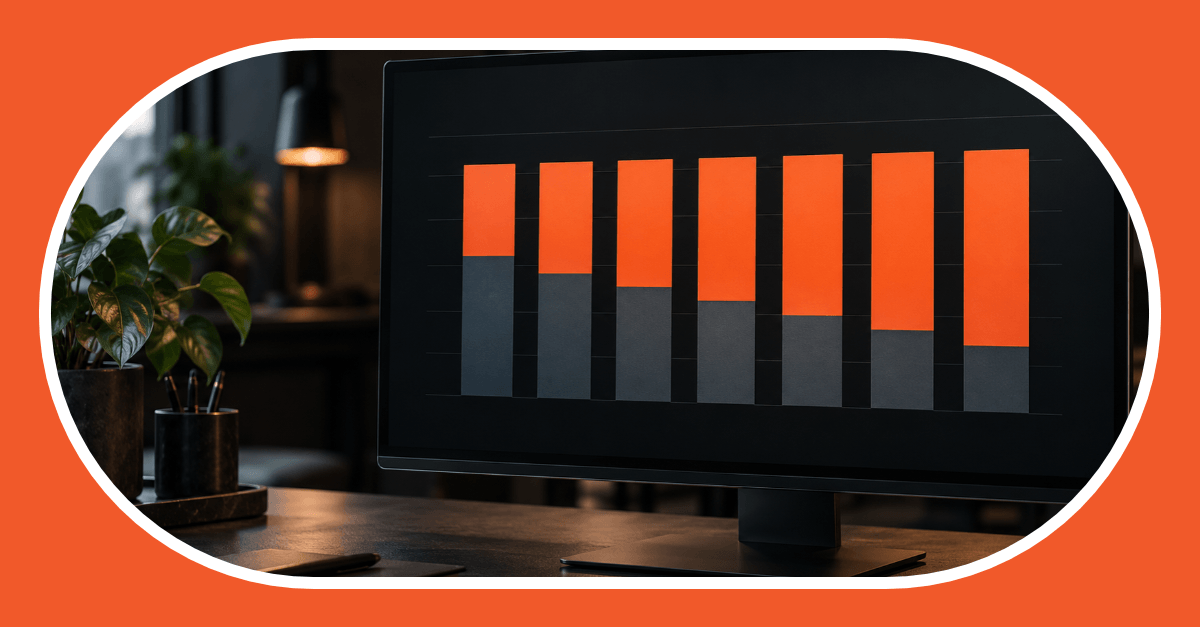
Revenue vs delivery cost as you add users
The same revenue growth, with two different service delivery models.
Illustrative: $100 revenue per managed user a month. Reactive costs stay at 55% of revenue; proactive costs fall to 47.5% as tickets per user drop.
The solution isn't simply to resolve tickets faster or employ cheaper engineers. It's to fundamentally reduce the number of incidents that require human intervention.
The most profitable support ticket is often the one that never needs to be created in the first place.
Reducing ticket volumes means moving from a reactive service delivery model to one built around proactive maintenance, standardisation, automation and continuous improvement.
Below, we explore ten practical strategies to reduce MSP service desk ticket volumes, the financial impact of eliminating repetitive support work and how to build a more scalable service delivery operation without compromising customer satisfaction.
Why reducing service desk ticket volumes matters
Ticket volume is one of the biggest drivers of service delivery costs for an MSP. Every ticket creates work:
- Review the request
- Investigate the issue
- Talk to the customer
- Resolve it
- Document the outcome
Even a simple request can involve several interactions, while complex issues may be escalated between L1, L2 and L3 engineers before they're resolved.
Consider an MSP supporting 2,000 managed users who generate 1,200 tickets a month. At an average of 30 minutes of engineering effort each, that's 600 hours of capacity every month. At an illustrative fully loaded cost of $50 an hour, it represents $30,000 a month in direct labour effort, or $360,000 a year.
Now imagine eliminating 20% of that workload through proactive maintenance, standardisation and automation. Try it with your own numbers:
Ticket reduction calculator
Pre-filled with the example above. Change any number.
Enter a number between 1 and 1,000,000.
Enter a number between 0 and 1,000,000.
min
Enter minutes between 0 and 1,440.
$
Enter an hourly cost between $0 and $1,000.
%
Enter a percentage between 0 and 100.
Annual capacity value released
$72,000
120 hours a month, about 1.1 engineers of capacity
- Tickets needing engineers
- 1,200 → 960
- Engineering effort
- 600 → 480 hrs
- Monthly capacity value
- $30,000 → $24,000
- Tickets per managed user
- 0.60 → 0.48
- Hours released a year
- 1,440 hrs
| Service desk metric | Current model | Improved model |
|---|---|---|
| Monthly tickets requiring engineers | 1,200 | 960 |
| Average engineering time per ticket | 30 minutes | 30 minutes |
| Monthly engineering effort | 600 hours | 480 hours |
| Monthly labour capacity value | $30,000 | $24,000 |
| Annual labour capacity value released | – | $72,000 |
Illustrative example using an assumed $50 fully loaded hourly labour cost. Actual results depend on ticket complexity, staffing costs and the activities eliminated.
Reducing ticket volumes by 20% releases 120 hours of engineering capacity each month. That's capacity you can use to onboard customers, deliver projects, improve customer experience or avoid recruiting another engineer as the business grows.
The $72,000 is potential annual labour capacity value, not guaranteed cash savings. The financial benefit depends on whether the released time reduces expenditure, avoids future hiring or generates additional productive revenue.
Reducing reactive support demand lets MSPs break the traditional link between customer growth and engineering headcount.
Start by understanding where your tickets come from
Before trying to reduce ticket volumes, you need to understand why tickets are being generated. Most PSA platforms, including HaloPSA, ConnectWise PSA and Autotask, have reporting that helps identify support patterns.
Yet many MSPs focus their reporting on tickets opened, tickets closed, response times and SLA performance without analysing the underlying causes of demand. A useful starting point is to review three to six months of ticket data and classify it into meaningful categories, for example:
Where 1,200 monthly tickets come from
Illustrative ticket distribution, not an industry benchmark.
1,200tickets
a month
a month
- Microsoft 365 and identity25%
- Desktop and endpoint20%
- Application support15%
- User administration15%
- Monitoring and other13%
- Networking and connectivity12%
| Ticket category | Illustrative monthly volume | Percentage |
|---|---|---|
| Microsoft 365 and identity | 300 | 25% |
| Desktop and endpoint issues | 240 | 20% |
| Application support | 180 | 15% |
| Networking and connectivity | 144 | 12% |
| User administration requests | 180 | 15% |
| Monitoring and other incidents | 156 | 13% |
| Total | 1,200 | 100% |
Once tickets are categorised, you can start asking the right questions:
- Are the same issues occurring repeatedly?
- Are particular customers or users generating unusually high ticket volumes?
- Are outdated devices contributing to support demand?
- Could standard requests be handled through self-service?
- Are monitoring systems creating unnecessary alerts?
The answers often reveal that a relatively small number of recurring problems are responsible for a considerable share of the workload. Rather than trying to make every engineer slightly faster, focus on eliminating the activities that consume the most time.
10 ways to reduce MSP service desk ticket volumes
Each strategy helps reduce IT support tickets from a different angle: preventing incidents, automating repeatable work, deflecting simple requests or changing what the business measures.
- Eliminate recurring issues Prevent
- Add a Centralised Services Engineer Prevent
- Automate repetitive activities Automate
- Standardise customer environments Prevent
- Improve patching and maintenance Prevent
- Introduce customer self-service Deflect
- Replace problematic hardware Prevent
- Improve end-user training Deflect
- Reduce RMM alert noise Automate
- Make ticket reduction a KPI Measure
01
Eliminate recurring issues through root cause analysis
PreventOne of the most effective ways to reduce support demand is to identify and permanently resolve recurring problems. Many service desks become extremely good at resolving the same issues again and again without addressing why they keep happening.
For example, an engineer might fix a recurring Microsoft Outlook issue by recreating a user profile. The ticket is closed, the customer is happy and the engineer moves on. But if the same issue occurs across multiple users or devices, the underlying problem hasn't been resolved.
Fix it again
- Recreate the profile, close the ticket
- The same issue returns next week
- Success is measured by how fast repeat tickets close
Fix it for good (Problem Management)
- Spot patterns across related incidents
- Investigate and assign an owner for the root cause
- Correct the configuration, hardware, compatibility issue or process
Regularly review recurring ticket categories, identify the customers and devices generating repeat incidents, and assign ownership for permanent remediation. The financial benefit compounds over time, because eliminating a recurring issue removes the need to resolve it repeatedly.
Measure this
Instead of celebrating how quickly engineers close repeat tickets, track how many recurring issues are permanently eliminated.
02
Introduce a dedicated Centralised Services Engineer
PreventMost MSPs have engineers responding to support requests, but fewer dedicate enough resources to preventing those requests in the first place. That's where a Centralised Services Engineer plays a vital role.
Unlike service desk engineers, Centralised Services Engineers focus on the ongoing health, standardisation and proactive management of customer environments. Their responsibilities may include:
- Monitoring endpoint and infrastructure health
- Managing patch compliance
- Developing and maintaining remediation scripts
- Standardising configurations
- Identifying recurring incidents
- Improving RMM monitoring policies
- Maintaining baseline security configurations
- Implementing proactive maintenance
- Developing automated remediation workflows
The objective is to remove the causes of reactive support demand. If an MSP receives 50 tickets a month from a recurring application issue, a Centralised Services Engineer may be able to find the underlying configuration problem and eliminate most of them.
Recurring tickets a month50
At 30 minutes each25 hrs
Engineering time a year if left unfixed300 hrs
The benefit isn't just engineering time. Customers experience fewer disruptions, service desk capacity improves and the MSP becomes less dependent on continuously hiring support engineers.
Measure this
Judge a Centralised Services Engineer on improvements in operational health and reductions in preventable incidents, not on the number of tickets they close.
03
Automate repetitive support activities
AutomateMany MSP tickets involve predictable processes that follow the same steps every time:
Password resetsAccount unlocksUser onboardingOffboardingLicence assignmentsRoutine endpoint remediation
These are ideal candidates for automation because they have defined inputs, repeatable processes and clear expected outcomes. Platforms such as Rewst, Pia and n8n can orchestrate these workflows across your PSA, RMM, Microsoft 365 and other business systems, and Microsoft Entra ID's native self-service password reset may remove common identity requests altogether.
Take an MSP receiving 150 routine user administration requests a month at 15 minutes each: 37.5 hours a month. If secure automation and self-service eliminate 80% of that manual effort, it releases about 30 hours a month, or 360 hours a year, from one category of repetitive work.
Automation capacity estimator
Pre-filled with the example above.
Manual effort today37.5 hrs
Released a month30 hrs
Released a year360 hrs
Distinguish between eliminating a ticket and resolving it automatically. An automated request may still be logged as a ticket for auditing, reporting or billing, even though no engineer touches it.
Measure this
Track tickets requiring human intervention, supported by a measure of engineering hours saved.
Choosing a platform? Read Rewst vs Pia vs n8n or browse 20 MSP automation ideas that deliver ROI.
04
Standardise customer technology environments
PreventOne hidden driver of MSP support costs is the complexity of supporting too many technologies and configurations. When every customer has a different firewall, backup solution, endpoint security platform, device configuration and Microsoft 365 policy, engineers have to maintain knowledge across an increasingly fragmented environment.
That increases troubleshooting complexity, reduces opportunities for automation and makes consistent support harder.
Six customers, five layers of the stack
Illustration: with a fragmented approach, six customers can mean up to 30 different configurations across five layers. With a standard stack there are five configurations to master.
Reduce this complexity by establishing standard technology stacks and encouraging customers to adopt approved configurations: a preferred RMM platform, endpoint security solution, backup platform, device management approach and Microsoft 365 configuration baseline.
The more consistent customer environments become, the easier it is to develop repeatable processes, proactively spot problems and automate routine work across many customers at once, creating economies of scale.
Some customers will have legitimate requirements for specialised technology. The goal isn't to eliminate flexibility, but to reduce unnecessary variation that adds cost without creating meaningful value.
05
Improve patch management and proactive maintenance
PreventPoorly maintained endpoints and infrastructure generate recurring incidents involving performance, application compatibility, security and stability. When patching and maintenance are mainly reactive, engineers spend time on problems that may have been preventable.
A more proactive approach uses your RMM, Microsoft Intune and other management platforms to monitor patch compliance, identify failed updates, validate system health and trigger remediation, within a consistent maintenance cycle:
- TestValidate updates before broad rollout
- ScheduleDeploy in agreed maintenance windows
- MonitorTrack compliance and system health
- Report exceptionsSurface failed or skipped updates
- EscalateRoute unsuccessful updates to an owner
- Roll back if neededUnder proper change management
Repeat every cycle
The objective isn't simply a high patch compliance percentage. It's fewer incidents caused by outdated or unstable systems.
- Patch deployment can introduce problems of its own, so changes need appropriate testing, rollback procedures and change management.
Managed well, proactive maintenance reduces avoidable incidents while improving the reliability and security of customer environments.
06
Introduce customer self-service
DeflectNot every request needs a service desk engineer. Many routine activities can be completed through secure self-service:
Resetting passwordsRequesting approved softwareSubmitting onboarding detailsTracking support requestsFinding knowledge articles
Self-service portals, Microsoft Teams-based support experiences and structured request forms let customers complete simple tasks without waiting for an engineer. Platforms such as Pia and Rewst support customer-facing automation, and native Microsoft capabilities may already cover some needs.
The key is making self-service genuinely easier than contacting the service desk. If customers have to navigate a confusing portal or follow complicated instructions, they'll go straight back to emailing or calling support. Good self-service is:
- Intuitive enough to use without instructions
- Secure by design
- Built into the way customers already work
- Backed by a clear route to a human
The objective is to eliminate unnecessary effort, not to create barriers that discourage customers from asking for help.
07
Replace problematic hardware before it generates more tickets
PreventAgeing or unreliable hardware can become a significant source of recurring workload. A device with repeated performance, connectivity or hardware problems may consume more support time over its remaining life than it would cost to replace.
MSPs often keep troubleshooting these devices because the customer controls replacement decisions. That's where asset lifecycle management and proactive customer engagement pay off: identify devices generating unusually high ticket volumes and compare the cost of ongoing troubleshooting with the cost of replacement.
Repair or replace?
Example figures. Enter the numbers for one problem device.
Enter a number between 0 and 100.
min
Enter minutes between 0 and 1,440.
$
Enter an hourly cost between $0 and $1,000.
months
Enter between 1 and 120 months.
$
Enter a cost between $0 and $100,000.
Verdict
Replace it
Keeping it costs $600 more over 24 months
- Support cost a month
- $75
- Break-even point
- Month 16
Excludes user downtime and lost productivity, which usually strengthen the case for replacement.
These findings belong in your Quarterly Business Reviews (QBRs), backed by asset lifecycle reporting and technology refresh recommendations. Instead of a generic "replace ageing equipment" message, you can show the real operational impact of keeping unreliable devices in service. Customers make better investment decisions, and avoidable support demand falls.
08
Improve end-user training and communication
DeflectSome recurring requests aren't caused by technology failures, but by gaps in user knowledge or unclear processes. Common examples include Microsoft Teams features, file sharing, phishing awareness, password management and business applications.
Resolving the same questions without addressing the knowledge gap creates support demand that could be avoided. Short training sessions, targeted knowledge articles, onboarding materials and proactive communication all help customers use their technology with confidence.
- Spot the patternA customer keeps raising tickets about Teams meetings.
- Target the gapRun a short session or publish a well-designed guide.
- Check the resultWatch that ticket category fall in your PSA data.
Use service desk data to identify training needs rather than producing generic content customers may never use. It also shifts the relationship from reactive problem-solving to proactive technology enablement.
09
Reduce unnecessary RMM alerts and monitoring noise
AutomateMonitoring is central to proactive support, but poorly configured monitoring creates substantial extra workload. An MSP might receive hundreds of notifications a day about transient events, duplicate alerts or conditions that don't need a human. If those alerts automatically create PSA tickets, the service desk spends considerable time on activity with little operational value.
From raw alerts to work that needs an engineer
Illustrative. Each step should remove noise without removing visibility.
All monitoring alerts
Remove duplicate notifications
Adjust thresholds
Correlate related events
Auto-fix known issues
What's left: alerts that genuinely need an engineer
- Alert reduction must be done carefully. Silencing important alerts just to cut ticket volumes increases operational risk. The goal is better quality, more actionable monitoring, not less visibility.
A well-configured monitoring system helps engineers focus on issues that genuinely need attention while automatically handling appropriate routine conditions.
10
Make ticket reduction a core operational KPI
MeasureMost MSPs measure service desk performance through response times, resolution times, closure rates and customer satisfaction. They matter, but they can unintentionally build a culture focused on processing tickets rather than preventing them. If the only measure of success is how quickly engineers close tickets, there's little incentive to eliminate the underlying problems.
Measures ticket processing
- Response time
- Resolution time
- Ticket closure rate
- Customer satisfaction
Also measures demand reduction
- Preventable incidents
- Recurring ticket categories
- Automated resolutions
- Proactive remediation outcomes
- Engineering hours eliminated
Service Delivery Managers should regularly review these trends and identify the activities causing the most avoidable workload. Making ticket reduction part of operational management encourages engineers to look beyond the immediate incident, and over time shifts the service desk from a reactive function into a proactive, efficient service delivery operation.
How to measure MSP ticket reduction
Counting fewer tickets isn't enough to prove service delivery has improved. Ticket numbers can fall because issues are being prevented, but also because customers are struggling to contact support, incidents aren't being recorded properly or requests have moved into other systems. Measure several related indicators:
| Metric | What it measures | Why it matters |
|---|---|---|
| Tickets per managed user | Monthly ticket volume divided by managed users | Normalises ticket demand as the customer base grows |
| Human-assisted ticket volume | Tickets requiring technician intervention | Shows whether automation is reducing manual workload |
| Preventable incident rate | Incidents attributed to avoidable causes | Measures opportunities for proactive improvement |
| Repeat incident rate | Recurring incidents within a defined period | Highlights unresolved underlying problems |
| Engineering hours per managed user | Total support labour relative to users supported | Connects ticket reduction with actual workload |
| Cost per ticket | Average cost of resolving tickets | Measures service desk economics |
| Cost per managed user | Total support delivery costs relative to managed users | Helps assess financial efficiency |
| Customer satisfaction | Customer feedback and support experience | Ensures efficiency doesn't come at the expense of service quality |
Pay particular attention to engineering hours per managed user and total support cost per managed user. They give a more complete picture of MSP service desk efficiency than ticket volumes alone. If you cut tickets by 20% but the remaining tickets become much more complex, total workload may not fall by the same proportion.
Likewise, automating simple tickets can make your average cost per remaining ticket go up, because the service desk now handles a higher share of complex issues:
Total monthly support cost
Before
After
Down 7%Average cost per ticket
Before
After
Up 17%Illustrative: 1,200 tickets taking 600 hours at $50 an hour. Automating 240 simple 10-minute tickets leaves 960 tickets taking 560 hours.
That doesn't mean automation has failed. It shows why operational metrics should be read together rather than in isolation.
The financial impact of reducing reactive support
For MSP owners, the ultimate value of reducing ticket volumes is better service delivery economics. Consider an MSP generating $200,000 in monthly managed services revenue with $110,000 in direct service delivery costs: a 45% service gross margin.
Now assume automation, proactive remediation and better standardisation let it avoid $15,000 a month in direct delivery costs that it would otherwise have incurred. Model your own business:
Service gross margin simulator
Pre-filled with the example above. Add any investment needed to deliver the improvements.
$
Enter revenue above $0.
$
Enter a cost of $0 or more.
$
Enter an amount from $0 up to your delivery costs.
$
Enter an amount of $0 or more.
Service gross margin change
+7.5pts
From 45% to 52.5%
- Monthly delivery costs
- $110,000 → $95,000
- Monthly gross profit
- $90,000 → $105,000
- Annual gross profit
- $1.08M → $1.26M
- Additional annual gross profit
- $180,000
| Financial metric | Current model | Improved model |
|---|---|---|
| Monthly managed services revenue | $200,000 | $200,000 |
| Direct service delivery costs | $110,000 | $95,000 |
| Monthly gross profit | $90,000 | $105,000 |
| Service gross margin | 45% | 52.5% |
| Annual gross profit | $1,080,000 | $1,260,000 |
Illustrative example. Assumes the $15,000 monthly cost reduction or cost avoidance is fully realised and excludes any additional investment required to deliver the improvements.
In this example the MSP increases its gross margin by 7.5 percentage points and creates an additional $180,000 in annual gross profit. The improvement doesn't come from more customers or higher prices. It comes from delivering existing services more efficiently. (For context, see what a good gross margin looks like for an MSP.)
Account for the cost of automation platforms, dedicated engineering resources and any other investment needed to deliver these improvements; the simulator's investment field shows how they change the result.
Reducing ticket volumes creates the opportunity for better margins. Turning it into financial performance takes disciplined execution and cost management.
A practical 90-day plan to reduce MSP ticket volumes
You don't need to redesign your entire service delivery operation to start reducing ticket demand. A structured 90-day programme builds momentum and demonstrates measurable results.
Days 1–30
Understand the workload
- Analyse the previous three to six months of PSA data
- Find the highest-volume categories, high-demand customers, recurring incidents, unnecessary escalations and repetitive admin
- Baseline tickets per managed user, engineering hours, repeat incidents and customer satisfaction
- Pick three to five opportunities with clear impact and manageable complexity
Days 31–60
Eliminate the obvious problems
- Assign an owner to each opportunity
- For example: self-service password reset, automating a recurring account task, fixing an endpoint configuration or an unreliable monitoring policy
- Document the baseline workload and expected reduction in manual effort
- Test and put controls in place before deploying broadly
Days 61–90
Measure, refine and expand
- Review results against the baseline: tickets, manual effort, disruptions and support quality
- Document outcomes and calculate the capacity released
- Identify the next set of opportunities
- Set up an ongoing review of recurring problems and automation candidates
Aim for a continuous improvement programme, not a one-off ticket reduction exercise. Over time, this approach can materially change the economics of delivering managed services.
Why reducing tickets is better than simply hiring more engineers
When ticket volumes rise, hiring another engineer brings immediate relief. But unless the underlying causes of workload growth are addressed, the business gets trapped in a cycle where every increase in revenue needs a similar increase in headcount. That limits gross margin improvement and makes growth dependent on recruiting and managing more people.
Engineers needed as you grow
Hiring to match ticket growth vs reducing the effort each user needs.
Illustrative: one engineer per 200 managed users today, with the reduction path cutting engineering effort per user by a quarter over the period.
A more scalable approach is to invest in capabilities that lift service desk productivity across the whole service delivery operation. One capable Centralised Services Engineer who eliminates recurring issues across hundreds of endpoints may release more cumulative capacity than another reactive support engineer. A dedicated Automation Engineer who builds repeatable workflows across many customers can help absorb future growth without increasing service desk headcount at the same rate.
This doesn't remove the need for more engineers. As an MSP grows, it will still need technical capability, customer support and specialist expertise. (Our MSP staffing calculator helps you size that.) But it changes the question:
From“How many more engineers do we need?”
To“How can we reduce the engineering effort required to support each customer?”
That's a much more valuable question for building a scalable, profitable MSP.
How Dijital Team helps MSPs reduce reactive support
At Dijital Team, we believe improving MSP profitability is about more than reducing the cost of technical resources. It's about improving the way services are delivered and helping MSPs move from reactive support to proactive, efficient operations. Through our dedicated offshore staffing model, we help MSPs build the capabilities to reduce repetitive work, improve engineering productivity and create capacity for growth.
Dedicated Centralised Services Engineers
Focused on the underlying causes of recurring support issues: proactive monitoring, maintenance, endpoint standardisation, patch management, scripting and automated remediation. Rather than resolving tickets faster, they reduce the number of incidents that need human intervention.
What a Centralised Services Engineer does →Automation Engineers
Skilled across Rewst, Pia, n8n and Microsoft Power Platform, plus scripting and API integration, to automate service desk processes, user administration, reporting and proactive remediation.
Automation Engineers →L2 and L3 Engineers
For issues that can't be prevented or automated. Dedicated engineers who work inside your PSA, RMM, documentation and processes, improving resolution capability and cutting unnecessary escalations.
L2 and L3 Engineers →Transparent fixed monthly pricing
One fixed monthly fee per role, with predictable staffing costs and no unexpected employment-related surcharges, so you can plan investment in proactive engineering and automation.
See all roles →The Better Business Pathway
Beyond staffing, we help MSPs strengthen operational maturity, improve profitability and grow sustainably, so costs don't rise at the same rate as revenue.
Explore the Pathway →The objective isn't simply to employ more engineers at a lower cost. It's to build a service delivery model that becomes progressively more efficient, scalable and profitable.
The bottom line: stop managing tickets and start eliminating them
Every support ticket is an opportunity to help a customer. But recurring and preventable tickets are also an opportunity to improve how services are delivered.
The most effective MSPs don't just measure how quickly tickets are resolved. They invest in understanding why tickets are created and what can be done to stop them happening again. Through automation, proactive maintenance, standardisation, root cause analysis and better service delivery processes, they reduce repetitive workloads, improve customer satisfaction and create capacity for growth.
More importantly, they start to break the traditional link between more customers and more engineering headcount.
The objective isn't to make it harder for customers to raise tickets. It's to give them fewer reasons to need support.
That's how MSPs move from reactive service delivery to a more mature, scalable and profitable operating model.
Frequently asked questions
Start by categorising three to six months of PSA data to find the recurring problems behind most of the workload. Then combine root cause analysis, a dedicated Centralised Services Engineer, automation, standardised environments, proactive patching, self-service, hardware replacement, targeted user training and RMM alert tuning, and make ticket reduction an operational KPI.
In our example, an MSP handling 1,200 tickets a month at 30 minutes each spends 600 engineering hours. Preventing 20% releases 120 hours a month, worth $72,000 a year at $50 an hour. That's capacity value rather than guaranteed cash savings: the benefit depends on whether you reduce costs, avoid hiring or use the time productively.
A Centralised Services Engineer focuses on preventing support demand rather than responding to it: monitoring endpoint and infrastructure health, managing patch compliance, standardising configurations, building remediation scripts, improving RMM policies and fixing the causes of recurring incidents. They're measured on operational health and fewer preventable incidents, not tickets closed.
Both are possible. An automated request may still be logged as a ticket for auditing, reporting or billing even though no engineer touches it. That's why the most useful metric is tickets requiring human intervention, supported by engineering hours saved.
Automation usually removes the simplest tickets first, so the service desk handles a higher share of complex work and the average cost per remaining ticket goes up, even while total support cost falls. Read cost per ticket alongside engineering hours and cost per managed user.
In our illustrative example, an MSP with $200,000 in monthly revenue and $110,000 in delivery costs that avoids $15,000 a month in costs moves from a 45% to a 52.5% service gross margin, adding $180,000 in annual gross profit before any investment needed to deliver the improvements.
Hiring brings immediate relief, but without tackling the causes of workload growth every increase in revenue needs a similar increase in headcount. Reducing the engineering effort each customer needs lets you absorb growth without adding service desk headcount at the same rate. You'll still need engineers as you grow, just fewer of them.
Ready to reduce reactive support and improve your MSP margins?
If your service desk is overwhelmed by repetitive tickets, recurring issues and rising engineering costs, we can help you reduce reactive workload, improve service delivery efficiency and build a more scalable MSP.
- Centralised Services Engineers
- Automation Engineers
- Experienced L2 and L3 engineers
- The Better Business Pathway